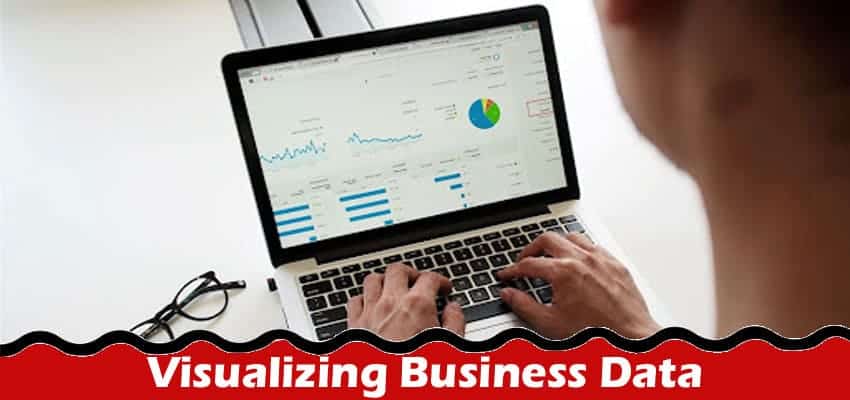
In today’s world, where every company is drenched in a sea of information, being able to transform complex data into comprehensible knowledge is crucial. Data visualization is an indispensable tool that enables a business to understand vast amounts of data. It offers an accessible way to see and understand patterns, outliers, and trends in data. Being an essential part of modern business intelligence, data visualization brings a new dimension to the table by providing visuals that best communicate the insight extracted from the data. In this article, we are going to explore the best methods for visualizing business data.
Pie Charts
A pie chart is an effective tool for representing proportional or percentage data. They provide a visual representation of data comparison in a single entity divided into portions. Each sector of the ‘pie’ represents a specific category within the total dataset. The pie chart is most effective when used to represent just a few categories, as too many can cause difficulty in interpretation.
The size of each slice of the pie allows viewers to understand the proportion of each category at a glance, thereby enhancing comprehension and the ability to draw conclusions quickly. In a business setting, pie charts are widely used to depict the distribution of resources, categorize expenses, and demonstrate the percentage market share of a company in comparison to its competitors.
The simplicity of the pie chart allows anyone, regardless of their expertise in data analysis, to grasp key insights. Moreover, the eye-catching and easy-to-understand visual nature of pie graphs makes them an effective communication tool, enabling individuals within an organization to share findings, present reports, and facilitate discussions with stakeholders in a clear and engaging manner.
Line Graphs
Line graphs are another common method for visualizing data, particularly when it comes to demonstrating trends over time. Due to its visual nature, a line graph can effectively show the rise and fall of data values over a particular period. They are predominantly used in business for financial analyses, sales forecasting, and reflecting performance metrics over time.
For instance, a business can use a line graph to track its monthly sales over the past year or analyze the trend of website traffic. Viewing this information on a line graph can help to identify significant spikes or dips in sales or website visits, which could trigger further analysis to uncover the potential cause.
Bar Graphs
Bar graphs, used widely, serve as a straightforward yet powerful tool for data visualization in businesses, especially when comparing the magnitude of different items. Its simplicity, clarity, and easy construction make it popular in professional industries. A bar graph acts as a pictorial representation of data where the length of bars corresponds to the magnitude or frequency of the data item. It provides an instant comparison and trends over time among groups and categories.
Therefore, businesses often use bar graphs to present quarterly sales data, monthly new customer acquisition, or the performance of different teams. The clear layout and intuitiveness of bar graphs make it relatively easy for users to interpret and act upon the information presented.
Scatter Plots
Scatter plots, also known as scatter graphs or scatter diagrams, are great tools to visualize two-variable sets of data and illustrate their relationship, if any. They’re incredibly effective for showcasing correlations, trends, concentrations, and outliers. A scatter plot uses dots to represent data values for two numerical variables plotted along two axes, namely the horizontal (x-axis) and vertical axis (y-axis).
For instance, a business could use a scatter plot to show the relationship between the number of employees and productivity levels or between a product’s price and its sales. The scatter plot can help identify whether an increase or decrease in one variable correlates with an increase or decrease in the other variable. This information can be useful for identifying patterns and making predictions.
Data visualization is an essential tool for modern businesses. By understanding and applying the best methods for visualizing business data, companies can gain valuable insights that inform strategic decision-making and help them maintain a competitive edge in the marketplace.
